2026 Medical Billing Benchmark Report: What Are Normal Denial Rates and A/R Days by Specialty?
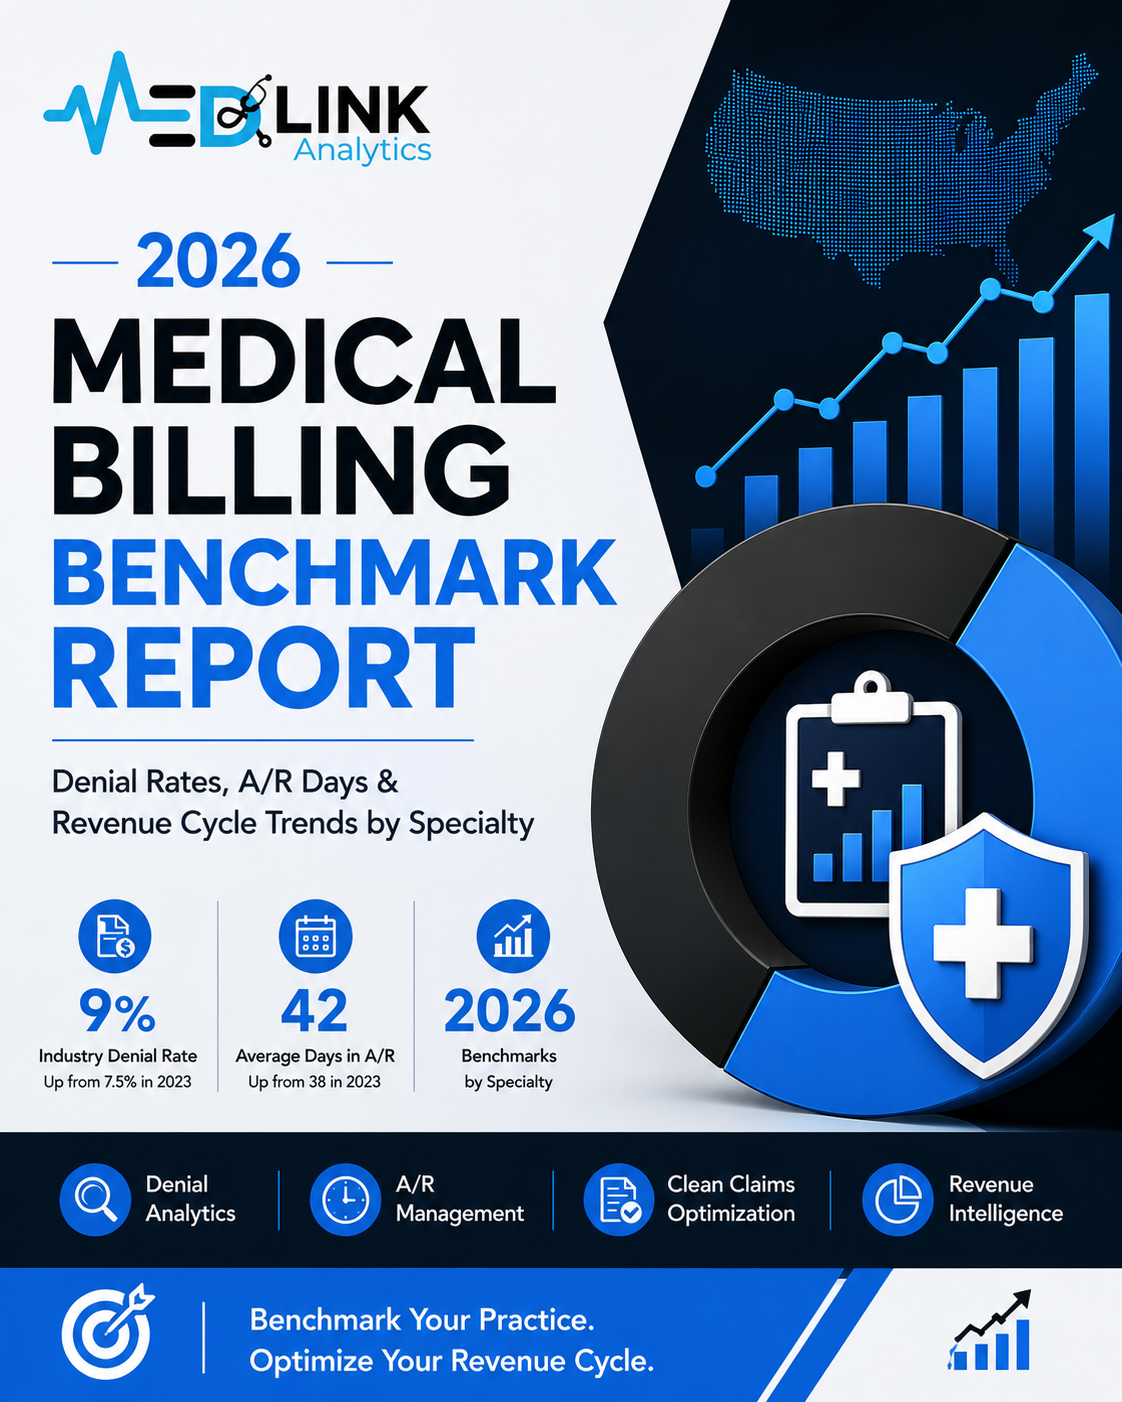
Quick answer: The 2026 benchmark data cited in this report puts the overall medical claim denial rate at approximately 9% and average Days in Accounts Receivable (A/R) at 42 days, but specialty-level performance varies substantially. Neurology is reported at approximately 14% initial denials, while home health is reported at approximately 52 days in A/R. Physical therapy faces specialty-specific coding and documentation risks, while family practices may have significant revenue opportunities through underused Chronic Care Management (CCM) workflows.
For a medical practice, however, the national average is only the starting point. The more useful question is:
How does your practice’s denial rate, clean claim rate, A/R aging, collection performance, and revenue-cycle efficiency compare with other practices in the same specialty?
That is where specialty-specific medical billing performance analytics, healthcare claims data analytics, denial analytics, A/R analytics, and revenue cycle benchmarking become valuable.
Important: The benchmark figures discussed below are industry-level figures reported by the cited 2026 benchmark source. Practices should compare them with their own payer mix, specialty, geography, coding profile, claim volume, and historical performance before treating them as a target or universal standard.
Why Specialty-Level Medical Billing Benchmarks Matter
A national medical billing benchmark can tell you where the industry stands. It cannot necessarily tell you whether your practice is performing well.
Consider two practices:
- A neurology practice may have a higher denial rate because of complex EMG/EEG billing, modifier requirements, medical necessity documentation, and payer-specific edits.
- A family medicine practice may have a lower denial rate but still lose significant revenue through missed charges, underpayments, delayed A/R follow-up, incomplete documentation, or underutilized care-management services.
This is why modern revenue cycle management (RCM) increasingly depends on specialty-level data rather than a single national benchmark.
A useful benchmark analysis should evaluate:
- Clean claims rate.
- Initial and final denial rate.
- Claim rejection rate.
- Days in A/R.
- A/R aging by bucket.
- Net collection rate.
- Gross collection rate.
- Payment turnaround.
- Underpayment rate.
- Denial recovery rate.
- Appeal success rate.
- Coding accuracy.
- Eligibility-related denials.
- Prior-authorization-related denials.
- Timely-filing denials.
- Medical-necessity denials.
- Documentation-related denials.
- Payer-specific performance.
- Specialty-specific revenue leakage.
This broader view turns a medical billing benchmark report into an actionable revenue-cycle management tool.
The 2026 National Medical Billing Benchmark Picture
According to the 2026 benchmark report cited in this article:
- Industry-wide claim denial rate: approximately 9%
- 2023 denial rate: approximately 7.5%
- Average Days in A/R: approximately 42 days
- 2023 average Days in A/R: approximately 38 days
The direction of both metrics matters.
When denial rates increase while A/R days increase, practices can experience a double financial impact:
More claims require work + payments take longer to arrive.
That combination increases administrative workload, slows cash flow, and can create hidden revenue-cycle costs.
For this reason, practices should not evaluate medical billing performance using denial rate alone. A practice with a 7% denial rate but 70-day A/R may have a more serious cash-flow problem than a practice with a 10% denial rate and 30-day A/R.
The most useful analysis looks at the entire claim lifecycle in healthcare.
Specialty Medical Billing Benchmark: Where the Problems Begin
| Specialty | Reported Denial Rate | Reported A/R | Major Revenue-Cycle Risk |
|---|---|---|---|
| Neurology | ~14% | — | EMG/EEG modifier and coding issues |
| Home Health | ~13% | ~52 days | OASIS documentation, NOA timing and billing workflow |
| Physical Therapy | ~11% | ~45 days | Unit calculation, KX modifier and plan-of-care documentation |
| Family Practice | Near national average | — | High claim volume and uncaptured care-management revenue |
These numbers illustrate an important principle:
The best medical billing strategy is specialty-specific.
A denial-management strategy designed for neurology may not solve the primary revenue-cycle problem in home health. Likewise, a family practice may have more opportunity in revenue capture and care-management workflows than in reducing an already-average denial rate by another percentage point.
1. Neurology: Modifier Accuracy Can Become a Major Denial Driver
Neurology is one of the clearest examples of why specialty-level billing analytics matter.
The benchmark report identifies neurology with an initial denial rate of approximately 14%, with EMG and EEG billing identified as a major source of errors.
For neurological practices, the audit should examine:
- CPT code selection.
- Modifier -26 usage.
- Modifier -TC usage.
- Professional versus technical component billing.
- Documentation supporting the service.
- Medical necessity.
- Payer-specific edits.
- Duplicate or conflicting procedure lines.
- Authorization requirements.
- Claim-scrubbing rules.
The objective should not simply be to count denials.
The objective is to identify the root cause of the denial pattern.
For example:
100 denied EMG claims → 63 related to modifier configuration → system/workflow correction → future denials prevented.
That is fundamentally different from manually appealing 100 claims one by one.
This is where denial management analytics, medical chart audit services, medical coding review, and healthcare claims data analytics can create more value than simple claim follow-up.
2. Home Health: A/R Performance Is Closely Connected to Documentation and Timeliness
Home health has a different revenue-cycle profile.
The benchmark report identifies approximately 52 days in A/R, making home health one of the specialties where operational discipline can have a major impact on cash flow.
CMS currently requires home health agencies to submit the Medicare Notice of Admission (NOA) within five calendar days after the start-of-care date. Late submission can result in payment reductions.
Documentation is also evolving.
CMS implemented OASIS-E2 effective April 1, 2026, making current OASIS-E2 knowledge important for home health documentation and quality workflows.
A home health revenue-cycle audit should therefore examine:
- NOA submission timeliness.
- Start-of-care workflow.
- Face-to-face encounter documentation.
- OASIS-E2 accuracy.
- Coding consistency.
- HIPPS-related processes.
- Medical necessity documentation.
- Claim submission timing.
- Payer edits.
- Denial categories.
- A/R aging.
- Rebilling and correction workflows.
The key lesson is that home health revenue cycle management cannot be separated from clinical documentation and operational compliance.
3. Physical Therapy: The 2026 KX Modifier Threshold Changed
Physical therapy practices face several specialty-specific billing risks, including time-based unit calculations, documentation requirements, medical necessity, plan-of-care requirements, and modifier usage.
One important correction to earlier versions of this article:
The CY 2026 Medicare KX modifier threshold is $2,480 for physical therapy and speech-language pathology services combined and $2,480 for occupational therapy services.
It is not $2,330. CMS confirms the 2026 threshold at $2,480.
The KX modifier is used when therapy services exceed the applicable threshold and the clinician attests that continued services are medically necessary and appropriately documented. CMS also continues to monitor documentation and medical necessity for therapy claims.
Physical therapy practices should therefore monitor:
- 8-minute rule calculations.
- CPT unit selection.
- KX modifier triggers.
- Medical necessity.
- Plan-of-care signatures.
- Recertification requirements.
- Documentation consistency.
- Timely claim submission.
- Payer-specific edits.
- Denial trends by therapist, CPT code, payer, and location.
A practice performance analytics dashboard can identify whether denials are isolated incidents or recurring workflow failures.
4. Family Practice: Revenue Capture May Matter More Than Denial Reduction
Family medicine and primary care practices operate differently from high-complexity specialties.
High patient volume, lower average reimbursement per encounter, preventive services, chronic disease management, and care-coordination opportunities can make revenue capture extremely important.
One area worth evaluating is Chronic Care Management (CCM).
CMS describes CCM as a Medicare-covered service for eligible patients with multiple chronic conditions that are expected to last at least 12 months or until death and place the patient at significant risk of death, acute exacerbation, decompensation, or functional decline.
CCM billing includes specific eligibility, initiating-visit, care-plan, documentation, time, and billing requirements. CMS lists codes including 99490, 99439, 99491, 99437, 99487, and related services.
Therefore, practices should not simply assume that every eligible patient generates a fixed monthly amount of revenue.
Actual reimbursement varies by code, payer, Medicare payment rules, locality, patient eligibility, and documented services.
The better question is:
How many eligible patients are being appropriately identified, enrolled, documented, monitored, and billed under compliant CCM workflows?
That is a measurable revenue-cycle opportunity.
The 2026 Revenue Cycle Metrics Every Medical Practice Should Track
A modern medical billing performance analytics solution should go beyond total collections.
At minimum, practices should monitor:
1. Clean Claims Rate
How many claims are accepted for processing without requiring correction or rework?
A high clean-claim rate generally indicates stronger front-end registration, eligibility, coding, documentation, and claim-submission processes.
2. Initial Denial Rate
How many submitted claims are initially denied?
Track this by:
- Payer.
- Provider.
- Specialty.
- CPT.
- ICD-10.
- Location.
- Denial reason.
- Date of service.
3. Final Denial Rate
Initial denial rate alone does not tell the complete story.
A practice should determine how many initially denied claims are ultimately recovered and how much revenue remains permanently lost.
4. Days in A/R
Days in A/R measures how long it takes, on average, for outstanding receivables to convert into cash.
A/R should be segmented into:
- 0–30 days.
- 31–60 days.
- 61–90 days.
- 91–120 days.
- 120+ days.
5. Net Collection Rate
Net collection rate helps determine how effectively the practice collects the reimbursement it is contractually entitled to receive.
6. Underpayment Rate
A claim can be technically “paid” while still being financially incorrect.
Underpayment analytics can identify:
- Contractual variance.
- Incorrect payer reimbursement.
- Missing payment.
- Partial payment.
- Bundling issues.
- Incorrect patient responsibility.
7. Appeal Success Rate
Track appeals by:
- Payer.
- Denial reason.
- Specialty.
- Dollar value.
- Appeal level.
- Recovery percentage.
8. Revenue Leakage
Revenue leakage can occur before a claim is even submitted.
Common examples include:
- Missed charges.
- Incorrect coding.
- Missing documentation.
- Uncaptured services.
- Eligibility failures.
- Authorization failures.
- Incorrect payer selection.
- Missed patient balances.
Medical Claims Analytics: Turning Billing Data Into Revenue Intelligence
Traditional billing reports tell you what happened.
Modern healthcare revenue intelligence should help explain:
Why did it happen?
For example:
Denial rate increased from 6.8% to 9.4%.
That is a useful observation.
But a stronger analytics system asks:
Which payer caused the increase?
Then:
Which CPT codes caused the increase?
Then:
Which denial reason caused the increase?
Then:
Is the problem concentrated among one provider, one location, one specialty, or one workflow?
This is the difference between reporting and medical claims analytics.
A practice can use claims data analytics to identify:
- Payer-specific denial patterns.
- Coding errors.
- Eligibility problems.
- Authorization failures.
- Documentation gaps.
- Timely-filing risks.
- Underpayments.
- Aging A/R.
- Provider-level performance.
- Specialty-level performance.
- Revenue opportunities.
From Claims Lifecycle to Revenue Cycle Intelligence
The healthcare claims lifecycle begins long before claim submission.
A simplified lifecycle includes:
Patient Registration → Eligibility Verification → Authorization → Clinical Documentation → Coding → Claim Scrubbing → Claim Submission → Payer Adjudication → Payment Posting → Denial Management → A/R Follow-Up → Appeals → Final Payment
A failure at any stage can affect downstream revenue.
For example:
Incorrect eligibility → claim rejection → delayed submission → delayed payment → increased A/R days
Or:
Incomplete documentation → medical necessity denial → appeal → additional administrative work → delayed revenue
This is why revenue cycle management should be viewed as a connected system rather than a collection of separate billing tasks.
Clean Claims Submission Is a Front-End Revenue Strategy
A clean claims submission service is not simply about sending claims quickly.
It should address potential problems before the claim reaches the payer.
Important pre-submission checks can include:
- Patient demographics.
- Insurance eligibility.
- Payer selection.
- Provider enrollment.
- Authorization.
- Referral requirements.
- ICD-10 coding.
- CPT/HCPCS coding.
- Modifier accuracy.
- Medical necessity.
- Documentation availability.
- Duplicate claim detection.
- Timely filing.
- Payer-specific claim rules.
This is where medical billing services, eligibility verification, claim scrubbing, coding review, and denial prevention intersect.
Automation can also help.
Practices increasingly evaluate technologies such as:
- Automated eligibility verification.
- RPA-based eligibility workflows.
- Automated claim scrubbing.
- AI-assisted coding review.
- Denial prediction.
- Automated work queues.
- Payer analytics.
- EHR/EMR integrations.
- Automated A/R prioritization.
The goal should not be automation for its own sake.
The goal is to reduce preventable administrative work while improving claim accuracy and revenue-cycle visibility.
2026 Trend: Prior Authorization and Interoperability Are Becoming Revenue-Cycle Issues
Prior authorization is increasingly connected to both clinical workflow and revenue-cycle performance.
CMS’s interoperability and prior authorization rules require certain impacted payers to implement operational changes beginning in 2026, while major API requirements generally begin in 2027. These requirements include prior-authorization APIs, provider access APIs, payer-to-payer data exchange, and additional transparency around prior authorization decisions.
CMS also reports that impacted payers must provide specific reasons for certain denied prior authorization decisions beginning in 2026.
For practices, this means prior authorization should increasingly be treated as a measurable component of the claims lifecycle in healthcare.
Track:
- Authorization volume.
- Approval rate.
- Denial rate.
- Turnaround time.
- Missing-documentation rate.
- Authorization-related claim denials.
- Payer-specific authorization performance.
- Appeals.
- Revenue delayed by authorization.
This creates an opportunity for healthcare revenue intelligence systems to connect authorization data with downstream claims and payment outcomes.
RCM Maturity Levels: Where Does Your Practice Stand?
One useful way to evaluate revenue cycle management is through maturity levels.
Level 1: Reactive Billing
The practice submits claims and waits for problems to appear.
Level 2: Denial Management
The practice actively works denied claims and performs basic A/R follow-up.
Level 3: Preventive RCM
The practice identifies recurring causes of denials and corrects upstream workflows.
Level 4: Data-Driven RCM
The practice uses payer, provider, CPT, denial, A/R, and collection data to make operational decisions.
Level 5: Revenue Intelligence
The practice combines claims data analytics, automation, clinical documentation, payer behavior, reimbursement trends, and predictive insights to identify revenue opportunities before losses occur.
The objective is not merely to process more claims.
It is to build a measurable, continuously improving revenue cycle.
Clinical Documentation Is Part of the Revenue Cycle
Clinical documentation is often treated as a clinical responsibility rather than a financial performance issue.
In reality, documentation can affect:
- Coding.
- Medical necessity.
- Claim acceptance.
- Prior authorization.
- Payer audits.
- Denial prevention.
- Quality reporting.
- Risk adjustment.
- Reimbursement.
This makes clinical documentation services, medical record auditing, coding audits, and documentation improvement important components of revenue-cycle optimization.
A practice experiencing repeated medical-necessity denials should not automatically assign the problem to the billing team.
The underlying cause may originate in documentation.
How to Benchmark Your Medical Practice in 2026
Instead of comparing one number against a national average, use a multi-metric scorecard.
Step 1: Establish Your Baseline
Measure at least 90–180 days of:
- Denial rate.
- Clean claims rate.
- Days in A/R.
- Net collection rate.
- Aging A/R.
- Underpayment rate.
- Appeal recovery.
- Claim volume.
- Payment turnaround.
Step 2: Segment the Data
Break performance down by:
Step 3: Find the Largest Revenue Leak
Do not automatically attack the metric with the highest percentage.
Calculate the actual dollar impact.
A 20% denial category affecting $10,000 may matter less than a 5% denial category affecting $500,000.
Step 4: Identify the Root Cause
Ask whether the problem originated in:
- Registration.
- Eligibility.
- Authorization.
- Documentation.
- Coding.
- Claim submission.
- Payer adjudication.
- Payment posting.
- A/R follow-up.
Step 5: Correct the Workflow
A sustainable RCM strategy fixes the process that produces the problem.
Step 6: Monitor the Result
After implementing the change, compare:
Before → Intervention → After
That creates measurable evidence of improvement.
Medical Billing Benchmark Checklist for 2026
Use this checklist when evaluating your practice’s revenue-cycle performance:
- Denial rate below your specialty benchmark.
- Clean claims consistently monitored.
- A/R days tracked monthly.
- 90+ day A/R actively managed.
- Payer performance reviewed.
- Eligibility verified before service.
- Prior authorization tracked.
- Coding accuracy audited.
- Clinical documentation reviewed.
- Underpayments identified.
- Denials categorized by root cause.
- Appeals tracked through resolution.
- Revenue leakage analyzed.
- Specialty-specific KPIs reported.
- Claims data connected to financial performance.
- Automation opportunities evaluated.
- EHR/EMR data flows reviewed.
- Revenue-cycle performance compared against historical trends.
Frequently Asked Questions About Medical Billing Benchmarks
What is the average medical claim denial rate in 2026?
The 2026 benchmark report cited in this article reports an industry-wide denial rate of approximately 9%, compared with approximately 7.5% in 2023. Practices should compare this figure with specialty-specific and payer-specific performance rather than treating it as a universal target.
What is a good denial rate for a medical practice?
There is no single ideal denial rate for every specialty. A meaningful target depends on payer mix, specialty, claim complexity, coding requirements, and practice workflows. The more useful approach is to establish a baseline, identify preventable denials, and continuously reduce root causes.
What is the average Days in A/R for medical practices?
The benchmark report cited here reports approximately 42 days in A/R nationally. However, A/R should be evaluated by specialty, payer, aging bucket, and reimbursement model.
Which medical specialty has the highest denial rate?
The cited 2026 benchmark report identifies neurology at approximately 14% among the major specialties covered, with EMG/EEG modifier and billing issues identified as important contributors.
Why is home health A/R so high?
The cited benchmark reports approximately 52 days in A/R for home health. Contributing operational issues can include documentation, NOA timeliness, coding, claim submission, payer processing, and denial management. CMS requires timely NOA submission within five calendar days of the start-of-care date.
What is the 2026 Medicare KX modifier threshold for physical therapy?
For CY 2026, CMS lists the KX modifier threshold at $2,480 for physical therapy and speech-language pathology services combined and $2,480 for occupational therapy services.
What is the 8-minute rule in physical therapy billing?
The 8-minute rule is used to determine billable units for certain time-based Medicare therapy services. Accurate time documentation and unit calculation are important because incorrect units can contribute to claim problems, compliance issues, and denials.
What is Chronic Care Management?
Chronic Care Management is a Medicare-covered service for eligible patients with multiple chronic conditions requiring ongoing care coordination. CMS specifies eligibility, initiating-visit, care-plan, time, and billing requirements.
What is revenue cycle management in healthcare?
Revenue cycle management is the end-to-end process of managing financial activity from patient registration and eligibility through coding, claim submission, payment posting, denial management, A/R follow-up, appeals, and final payment.
What is healthcare claims data analytics?
Healthcare claims data analytics is the process of analyzing claim, payer, coding, denial, reimbursement, and payment information to identify patterns, financial risks, operational inefficiencies, and revenue opportunities.
How can medical practices reduce claim denials?
The strongest approach is usually preventive rather than purely reactive. Practices should analyze denial root causes, verify eligibility, confirm authorization, improve coding and documentation accuracy, scrub claims before submission, monitor payer-specific patterns, and measure results over time.
What is a good Days in A/R target?
The appropriate target varies by specialty, payer mix, reimbursement model, and practice workflow. Rather than adopting one universal number, practices should benchmark against their historical performance and specialty peers while focusing particularly on aging A/R and 90+ day balances.
Averages Tell You Where the Industry Stands. Specialty Data Tells You Where to Look First.
A national benchmark is useful.
But it is not enough.
A 9% denial rate means something different to a neurology practice than it does to a family medicine practice.
42 Days in A/R can represent very different operational conditions depending on payer mix, specialty, claim volume, reimbursement timing, and the percentage of receivables older than 90 days.
The real value of medical billing benchmarking comes from answering five questions:
- Where are we today?
- How do we compare with our specialty?
- Which payer, provider, code, or workflow is causing the problem?
- How much revenue is affected?
- What process change will prevent the problem from recurring?
That is the difference between a billing report and revenue intelligence.
How MedLink Analytics Can Help Benchmark Your Revenue Cycle
MedLink Analytics provides medical billing, medical coding, denial management, A/R management, clinical documentation support, claims analytics, and revenue cycle management services for healthcare providers across the United States.
Our approach combines operational billing expertise with healthcare analytics, medical claims analytics, denial root-cause analysis, A/R performance monitoring, clean-claim optimization, and specialty-specific revenue-cycle benchmarking.
A practice benchmark can evaluate:
- Claim denial rate.
- Clean claims performance.
- Days in A/R.
- A/R aging.
- Payer performance.
- Coding accuracy.
- Documentation-related denials.
- Eligibility and authorization issues.
- Underpayments.
- Appeal recovery.
- Revenue leakage.
- Specialty-specific performance.
The objective is simple:
Find where your revenue cycle is performing normally, where it is underperforming, and where there is recoverable revenue hiding in the data.
If your practice does not know whether its denial rate, A/R days, clean claims, or collection performance are competitive for its specialty, a benchmark analysis is a better starting point than guessing.
MedLink Analytics
Medical Billing | Revenue Cycle Management | Denial Management | A/R Management | Healthcare Analytics
Phone: +1 (720) 780-3128
Email: contact@medlinkanalytics.com
Location: Denver, Colorado | Serving healthcare providers across all 50 states
References
- HIT Consultant — AMS Solutions State of Medical Billing 2026 benchmark report.
- Centers for Medicare & Medicaid Services — CY 2026 Therapy Services and KX Modifier Thresholds.
- Centers for Medicare & Medicaid Services — Chronic Care Management.
- Centers for Medicare & Medicaid Services — Home Health Quality Reporting and OASIS-E2.
- Centers for Medicare & Medicaid Services — Home Health Medicare Payment Systems and NOA requirements.
- Centers for Medicare & Medicaid Services — Interoperability and Prior Authorization Final Rule.
Editorial note: Benchmark figures are industry-level observations and should not be interpreted as guaranteed performance targets. Reimbursement, denial rates, A/R days, and revenue opportunities vary by specialty, payer, geography, coding, documentation, contract terms, patient population, and practice operations.
📞 +1 (720) 780-3128
✉ contact@medlinkanalytics.com
📍 Denver, CO | Serving all 50 states
🌐 medlinkanalytics.com