Why Medical Claims Actually Get Denied in 2026 (And Why Most Practices Never Appeal)
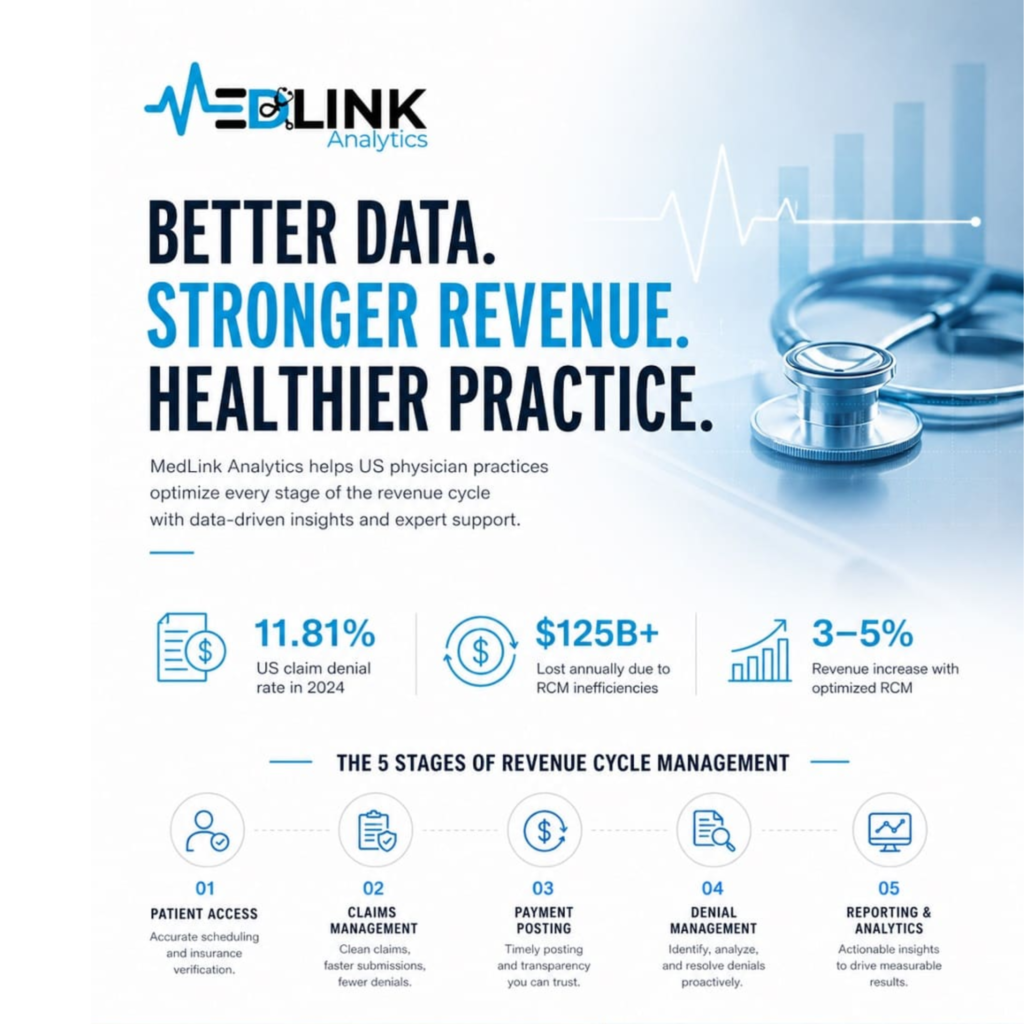
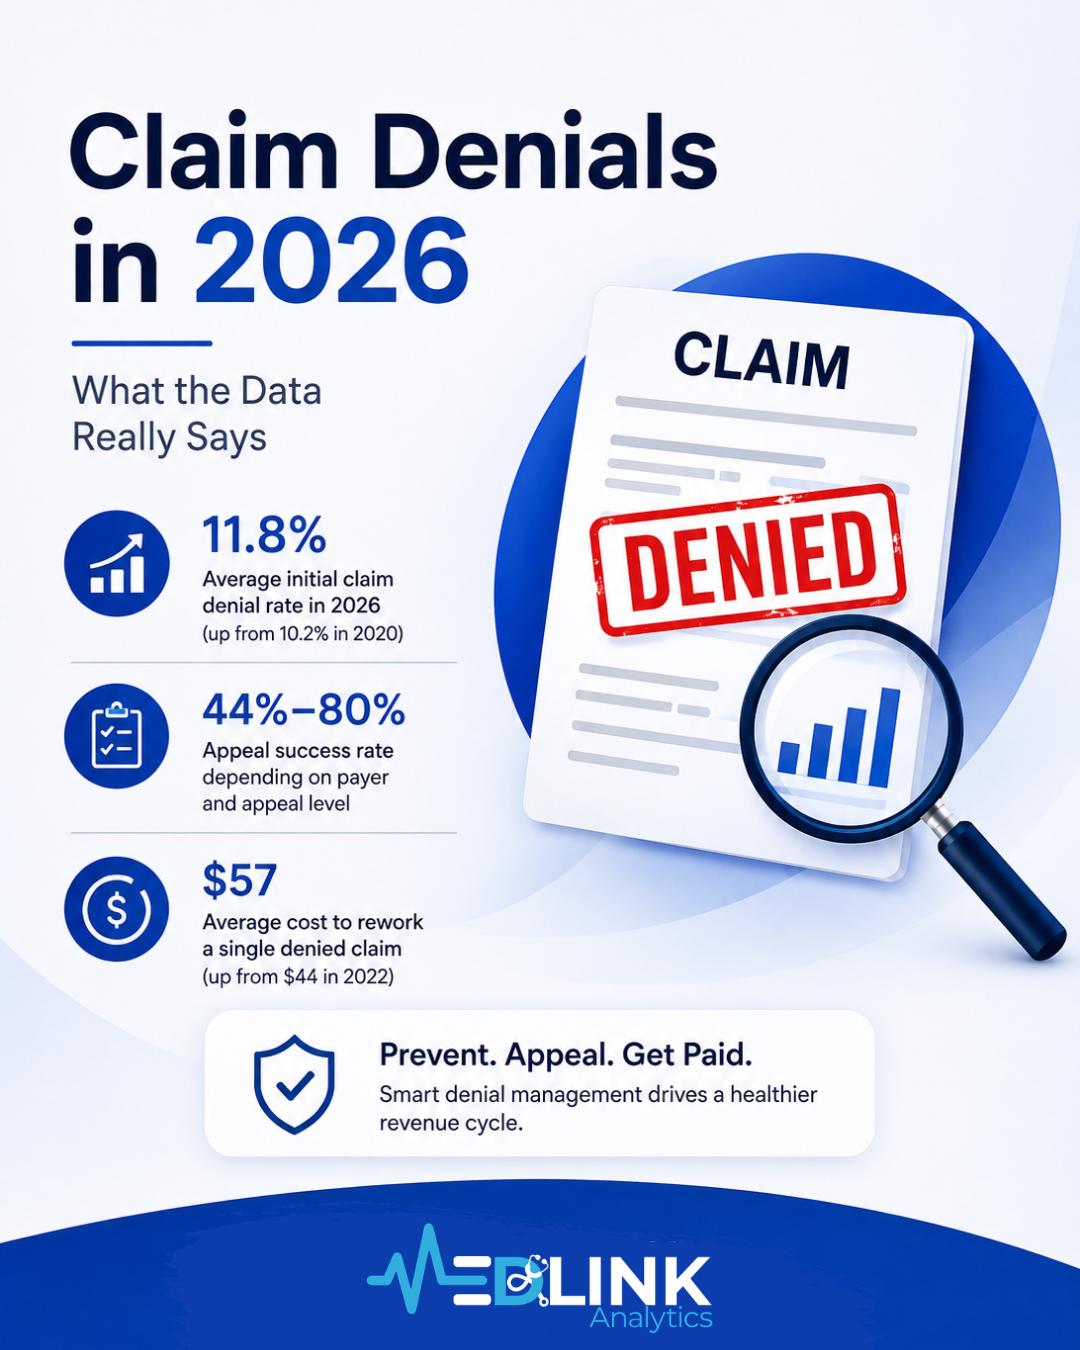
The average initial claim denial rate in the U.S. reached approximately 11.8% in 2026, up from 10.2% in 2020. Registration and eligibility errors are the single largest cause of denials (roughly 24%), followed by missing or invalid claim data (16%) and coding errors, which some 2026 industry analyses attribute to as much as 42% of denials when counted broadly. Despite this, only a small fraction of denied claims are ever appealed, industry estimates range from under 1% for patient-facing appeals to roughly 35% for provider-initiated appeals, even though properly filed appeals succeed 44% to 80% of the time depending on payer and appeal level.
Most practices think of denials as a coding problem. The data tells a more specific story: coding matters, but it’s often not even the top cause, and the bigger issue for most practices isn’t the denial itself, it’s what happens (or doesn’t happen) after it arrives.
The Denial Rate Is Still Climbing
The industry-wide initial denial rate has moved from 10.2% in 2020 to roughly 11.8% in 2024–2026, according to Experian Health’s State of Claims research. That national average masks meaningful variation by payer type:
| Payer Type | Approximate Denial Rate |
|---|---|
| Medicare fee-for-service | 4–6% |
| Medicare Advantage | 14–15.7% |
| Medicaid | 16.7% |
| Commercial payers | 8–14% |
| ACA marketplace plans | 19.1% (nearly 1 in 5 claims) |
Roughly 41% of providers now report denial rates at or above 10%, and more than half of revenue cycle leaders surveyed say claim errors are getting worse, not better — a trend most industry analysts attribute to stricter automated payer review, more frequent payer policy changes, and rising documentation requirements rather than providers submitting objectively worse claims than before.
What’s Actually Causing Denials
This is the part most practices get wrong: denials aren’t dominated by one single cause, and the leading cause usually isn’t coding at all.
Based on Optum’s Revenue Cycle Denials Index and corroborating 2026 industry data, the leading denial categories break down roughly as follows:
- Registration and eligibility errors, approximately 24% of all denials. Inactive coverage on the date of service, mismatched demographic information, or outdated insurance cards are the single largest denial category, and nearly all of it is preventable with real-time eligibility verification.
- Missing or invalid claim data — approximately 16%. Missing NPI, taxonomy codes, modifiers, or NDC numbers. These are typically fixable with a corrected claim rather than a full appeal.
- Coding errors (CPT/ICD-10/HCPCS) — cited anywhere from a meaningful minority to as much as 42% of denials depending on how broadly “coding” is defined and which categories are folded in. Incorrect codes, modifier misuse, and violations of National Correct Coding Initiative (NCCI) edits fall here.
- Missing or expired prior authorization. A persistent problem for imaging, surgery, specialty drugs, and therapy services in particular.
- Medical necessity disputes, where documentation doesn’t clearly support the service billed.
- Duplicate claims, timely filing violations, and coordination-of-benefits errors round out most of the remainder.
Taken together, five denial categories account for roughly 75% of all denials industry-wide, which is actually good news operationally. It means a practice doesn’t need to fix everything at once; targeting the top few categories with the highest volume can move a denial rate substantially.
It’s also worth distinguishing a rejection from a denial. A rejection happens before adjudication, the clearinghouse or payer’s front-end system catches a technical error (a missing field, an invalid code format) and kicks the claim back before it’s ever processed. A denial happens after the payer has processed the claim and made a coverage decision. The fix for each is different: rejections usually need a corrected resubmission, while denials often require a formal appeal with supporting documentation.
The Real Cost of a Denial Isn’t the Denied Dollar
Most practices track the dollar amount of a denied claim. Far fewer calculate the administrative cost of working it — which is where the real damage tends to hide.
The average administrative cost to rework a single denied claim rose to approximately $57 in 2023, up from about $44 the year before, according to Aptarro’s analysis of industry benchmarking data. For a mid-sized practice submitting 500 claims a month at an average value of $250, a 15% denial rate means roughly 75 denied claims monthly. At roughly $57 in administrative cost plus additional rework time, that’s several thousand dollars a month spent just managing denials — before a single dollar is actually recovered.
And a meaningful share of that effort produces nothing. Industry estimates suggest around 20% of worked denials are never successfully recovered, meaning the administrative cost is a pure loss on top of the original unpaid claim.
Why So Few Denials Get Appealed — And Why That’s a Mistake
This is the most striking gap in the data. On the patient side, Kaiser Family Foundation research found that fewer than 1% of denied claims are ever formally appealed by patients, despite internal appeals succeeding roughly 44% of the time. On the provider side, industry surveys suggest roughly 35% of denied claims are appealed by billing teams, leaving about 65% never resubmitted or appealed at all.
The appeal success rates make that gap harder to justify:
- Internal appeals to the insurer succeed in an estimated 44% to 57% of cases, depending on claim type and payer.
- At the external independent review stage, a legal right under the ACA when a plan upholds its own denial, success rates rise to roughly 72%.
- Overall appeal success rates across denial types and appeal levels are estimated at 57% to 80%.
- One state-level study published in JAMA found the share of denials overturned on appeal in New York rose from 38% in 2019 to nearly 53% in 2025 — suggesting either better-documented appeals or increasingly aggressive initial denials, or both.
In plain terms: for the roughly two-thirds of denied claims that are never appealed, a majority would likely have been paid if someone had simply filed the appeal. That’s not a coding problem or a technology problem, it’s a workflow and staffing capacity problem.
Where AI Fits, and Where It Doesn’t Yet
Provider sentiment on AI in claims management is telling. In Experian Health’s 2025 State of Claims survey, 67% of providers said they believe AI could improve the claims process — but only about 14% were actually using it at the time of the survey. That gap is closing quickly heading into 2026, particularly for two specific tasks: claim scrubbing before submission (catching coding and data errors automatically) and denial triage (flagging which denials are worth appealing based on dollar value and likelihood of success).
What AI hasn’t replaced is the underlying appeal-writing and documentation-gathering work required to actually win a contested claim — that still depends on staff time, payer-specific knowledge, and a documented case for medical necessity.
What This Means for Practices
The data points to a few concrete priorities, in rough order of impact:
- Fix eligibility verification first. It’s the single largest denial category and the easiest to prevent with real-time checks before the appointment.
- Build a denial log, not just a claims log. Categorize every denial by cause and payer; five categories drive roughly 75% of denials, so pattern recognition matters more than reacting claim-by-claim.
- Appeal more, not less. Given success rates well above 50% at most appeal stages, a policy of appealing every denial above a reasonable dollar threshold is very likely to pay for itself.
- Track prior authorization status against the actual CPT codes billed, not just whether authorization exists, mismatches between authorized and billed codes are a common, avoidable denial trigger.
- Calculate the true cost of denials, including administrative rework time, not just the face value of what was denied, this is usually the number that justifies investing in prevention.
References
- Experian Health : State of Claims Report 2025, as cited in Managed Healthcare Executive and multiple 2026 industry analyses. https://www.experian.com/healthcare
- Optum : 2024 Revenue Cycle Denials Index, as cited by athenahealth. https://www.athenahealth.com/resources/blog/medical-coding-mistakes-reduce-claim-denials
- Aptarro : 50+ US Healthcare Denial Rates & Reimbursement Statistics for 2026. https://www.aptarro.com/insights/us-healthcare-denial-rates-reimbursement-statistics
- Kaiser Family Foundation (KFF) : analysis of ACA marketplace claim denials and appeal rates, as cited by Counterforce Health and ClaimBack. https://www.kff.org
- Healthcare Dive : More insurance claims denials are being overturned upon appeal, study finds (JAMA study on New York appeal outcomes). https://www.healthcaredive.com/news/insurance-denials-overturned-appeal-new-york-study-JAMA/817490/
- Centers for Medicare & Medicaid Services (CMS) : Medicare Advantage prior authorization denial data. https://www.cms.gov
- Managed Healthcare Executive : Claim Denial Rates Increase for Third Consecutive Year, Survey Shows. https://www.managedhealthcareexecutive.com/view/claim-denial-rates-increase-for-third-consecutive-year-survey-shows
Denial-cause percentages and cost figures vary across industry sources depending on methodology, payer mix, and how categories are defined; figures in this article should be treated as directional industry benchmarks rather than universal statistics applicable to every practice.